Transport Fever 2: What Production, Shipment, and Transport really mean
In my Transport Fever 2 review I wrote about the how the game sometimes frustrates by leaving you guessing as to why a line isn’t working or a factory isn’t producing goods. Three key metrics - Production, Shipment, and Transport - are the root cause of many of these annoying issues, and my goal with this article is to explain exactly what they are to help anyone who is also stuck staring at them and wondering why they won’t increase.
No matter which of these figures you’re having trouble with, one key thing to remember is that they can take a little while to ramp up, even when you’ve solved the problem that was holding your industry back. So don’t expect the metrics to shoot up as soon as you make a change.
Before we jump into the nitty gritty of these numbers, a note on factory levels: If you can keep production, shipment, and transport in the section at the right-hand end of the counters, the Level bar will start to move up. When it crosses the next threshold, the factory will expand. It will require more resources, but if supplied with adequate materials it will also produce a greater volume of goods. This can be an effective way of satisfying demand without building additional transportation infrastructure.
Production
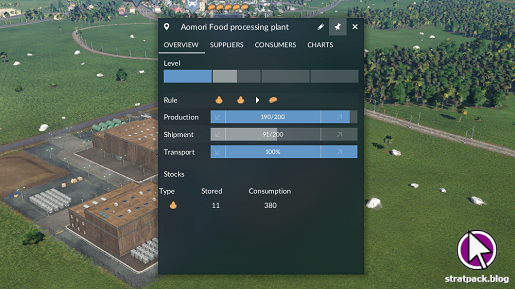
Production, as the name would suggest, indicates how many units of a certain product a facility is producing. The food processing plant in the example above produces one food unit for every two units of grain it receives, and is operating at a production level of 190/200.
Counterintuitively, product is driven by supply and not demand. To increase food production to 200, all I would need to do is supply more grain, perhaps by sourcing it from additional farms. This is true regardless of whether there are onward transport links to consumers. For example, if you were to supply a completely isolated food factory with grain, it would pay to receive the materials and produce food - that food would just disappear.
Shipment
Shipment indicates how many units of a particular product are shipped from the facility. This is reflective of how much demand there is for these goods at the destination city, and is also capped by the current level of production. This complexity makes it slightly more difficult to troubleshoot.
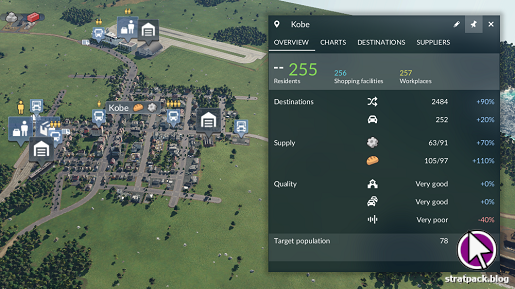
In the screenshot, shipment is 91. Production is 190, so we know it’s not being capped by the input. The city receiving the food is Kobe, and by opening the city dialogue box we can see that its food supply is currently 105/97. This explains our shipment figure - the amount of food required by the destination city is only a fraction of what the factory is able to produce.
If the city demand looks fine, it’s worth checking your transport links. Shipment levels will fall if there is no route from the producing facility to the destination. I once saw oil production and shipment fall off a cliff because I had accidentally deleted a road that made the drop-off truck stop accessible to the refinery. Rebuilding 10m of road saved an entire industry!
Transport
Finally, Transport is the percentage of the shipped units that make it to their destination. Ideally, this should always be 100 per cent - if it’s not, you’ve got a problem somewhere along the line holding things up.
In my experience, it’s rare to see a low Transport figure on an established line, and if there were issues then you’d likely have spotted them already because, well, the whole game is about transportation! One scenario that may catch you out, however, is if a factory levels up or a city’s demand increases due to growth and more goods are shipped than the line was originally designed for. In this case, you might need to introduce additional vehicles, or increase the capacity of those that are already running.


